Parameter Variations for annotation using Optimal Transport
This example uses TACCO with core annotation method OT and several parameter variations to show the dependence of the parameter choices on the quality of the annotation. The datasets are are taken from (Weinreb et al.) and (Avraham-Davidi et al.) or simulated using (Moriel) and (Kotliar).
(Weinreb et al.): Weinreb C, Rodriguez-Fraticelli A, Camargo FD, Klein AM. Lineage tracing on transcriptional landscapes links state to fate during differentiation. Science. 2020 Feb 14;367(6479):eaaw3381. doi: 10.1126/science.aaw3381. Epub 2020 Jan 23. PMID: 31974159; PMCID: PMC7608074.
(Avraham-Davidi et al.): Avraham-Davidi I, Mages S, Klughammer J, et al. Integrative single cell and spatial transcriptomics of colorectal cancer reveals multicellular functional units that support tumor progression. doi: https://doi.org/10.1101/2022.10.02.508492
(Moriel): Moriel, N. Extension of scsim single-cell RNA-sequencing data simulations. github.com/nitzanlab/scsim-ext (2023)
(Kotliar): Kotliar, D. scsim: simulate single-cell RNA-SEQ data using the Splatter statistical framework but implemented in python. github.com/dylkot/scsim (2021)
[1]:
import os
import sys

import matplotlib
import seaborn as sns
import pandas as pd
import numpy as np
import anndata as ad
import scipy.sparse
from scsim import scsim

import tacco as tc

# The notebook expects to be executed either in the workflow directory or in the repository root folder...
sys.path.insert(1, os.path.abspath('workflow' if os.path.exists('workflow/common_code.py') else '..'))
import common_code
Load data
[2]:
env_path = common_code.find_path('results/env_links')
datasets = {} # collect all datasets
[3]:
differentiation_data_path = common_code.find_path('results/single_cell_differentiation/data')
d4d6 = ad.read(f'{differentiation_data_path}/d4_d6_differentiation.h5ad')
d2 = ad.read(f'{differentiation_data_path}/d2_differentiation.h5ad')
datasets['Differentiation'] = { 'data': d2, 'ref': d4d6, 'ref_key': 'Cell type annotation', 'true_key': 'clone_fate', }
[4]:
scrnaseq_data_path = common_code.find_path('results/slideseq_mouse_colon/data')
scrnaseq = ad.read(f'{scrnaseq_data_path}/scrnaseq.h5ad')
datasets['Single cell'] = { 'data': scrnaseq, 'ref': scrnaseq, 'ref_key': 'labels', 'true_key': 'labels', }
Simulate data
In-silico mixture
[5]:
capture_rate = 1.0
bead_shape = 'gauss'
ntdata_max = 10**4
bead_size = 1.0
is_data = tc.tl.mix_in_silico(scrnaseq, type_key='labels', n_samples=ntdata_max, bead_shape=bead_shape, bead_size=bead_size, capture_rate=capture_rate,)
is_data.obsm['reads_labels'] /= is_data.obsm['reads_labels'].to_numpy().sum(axis=1)[:,None]
datasets['Mixture'] = { 'data': is_data, 'ref': scrnaseq, 'ref_key': 'labels', 'true_key': 'reads_labels', }
Dropout
[6]:
ngenes = 25000
descale = 1.0
ndoublets = 100
K = 13
nproggenes = 1000
proggroups = [1,2,3,4]
progcellfrac = .35
ncells = 1500
deprob = .025

seed = 111

deloc = 2.0

# simulating true counts (in simulator.counts)
simulator = scsim(ngenes=ngenes, ncells=ncells, ngroups=K, libloc=7.64, libscale=0.78,
             mean_rate=7.68,mean_shape=0.34, expoutprob=0.00286,
             expoutloc=6.15, expoutscale=0.49,
             diffexpprob=deprob, diffexpdownprob=0., diffexploc=deloc, diffexpscale=descale,
             bcv_dispersion=0.448, bcv_dof=22.087, ndoublets=ndoublets,
             nproggenes=nproggenes, progdownprob=0., progdeloc=deloc,
             progdescale=descale, progcellfrac=progcellfrac, proggoups=proggroups,
             minprogusage=.1, maxprogusage=.7, seed=seed)
simulator.simulate()

drop_ref = ad.AnnData(scipy.sparse.csr_matrix(simulator.counts), obs=simulator.cellparams, var=simulator.geneparams)
drop_ref.obs['group'] = drop_ref.obs['group'].astype('category')

dropshape, dropmidpoint = simulator.fit_dropout()

simulator.dropshape = dropshape
simulator.dropmidpoint = -1.0
simulator.simulate_dropouts()

drop_data = ad.AnnData(scipy.sparse.csr_matrix(simulator.countswdrop), obs=simulator.cellparams, var=simulator.geneparams)
drop_data.obs['group'] = drop_data.obs['group'].astype('category')

datasets['Dropout'] = { 'data': drop_data, 'ref': drop_ref, 'ref_key': 'group', 'true_key': 'group', }
Simulating cells
Simulating gene params
Simulating program
Simulating DE
Simulating cell-gene means
   - Getting mean for activity program carrying cells
   - Getting mean for non activity program carrying cells
   - Normalizing by cell libsize
Simulating doublets
Adjusting means
Simulating counts with scsim
Ambient
[7]:
ngenes = 25000
descale = 1.0
ndoublets = 100
K = 13
nproggenes = 1000
proggroups = [1,2,3,4]
progcellfrac = .35
ncells = 1500
deprob = .025

libloc=7.64
libscale=0.78


deloc = 5.0

seed=2

# simulating true counts (in simulator.counts)
simulator = scsim(ngenes=ngenes, ncells=ncells, ngroups=K, libloc=libloc, libscale=libscale,
             mean_rate=7.68,mean_shape=0.34, expoutprob=0.00286,
             expoutloc=6.15, expoutscale=0.49,
             diffexpprob=deprob, diffexpdownprob=0., diffexploc=deloc, diffexpscale=descale,
             bcv_dispersion=0.448, bcv_dof=22.087, ndoublets=ndoublets,
             nproggenes=nproggenes, progdownprob=0., progdeloc=deloc,
             progdescale=descale, progcellfrac=progcellfrac, proggoups=proggroups,
             cellbender=True, cb_ambient=False, #cb_droploc=0, cb_dropscale=1,
                  cb_dispshape=1, cb_dispscale=1,
             minprogusage=.1, maxprogusage=.7, seed=seed)
simulator.simulate()

amb_ref = ad.AnnData(simulator.counts, obs=simulator.cellparams, var=simulator.geneparams[[]])
amb_ref.obs['group'] = amb_ref.obs['group'].astype('category')

# get counts with ambient RNA (cellbender)
simulator.cb_ambient=True

simulator.cb_fraclib = 0.2
simulator.simulate_cellbender()

amb_data = ad.AnnData(simulator.counts, obs=simulator.cellparams, var=simulator.geneparams[[]])
amb_data.obs['group'] = amb_data.obs['group'].astype('category')

datasets['Ambient'] = { 'data': amb_data, 'ref': amb_ref, 'ref_key': 'group', 'true_key': 'group', }
Simulating cells
Simulating gene params
Simulating program
Simulating DE
Simulating cell-gene means
   - Getting mean for activity program carrying cells
   - Getting mean for non activity program carrying cells
   - Normalizing by cell libsize
Simulating doublets
Adjusting means
Simulating counts with cellbender
Plotting options
[8]:
highres = False
default_dpi = 100.0 # matplotlib.rcParams['figure.dpi']
if highres:
    matplotlib.rcParams['figure.dpi'] = 648.0
    hr_ext = '_hd'
else:
    matplotlib.rcParams['figure.dpi'] = default_dpi
    hr_ext = ''

axsize = np.array([4,3])*0.5
Run annotation
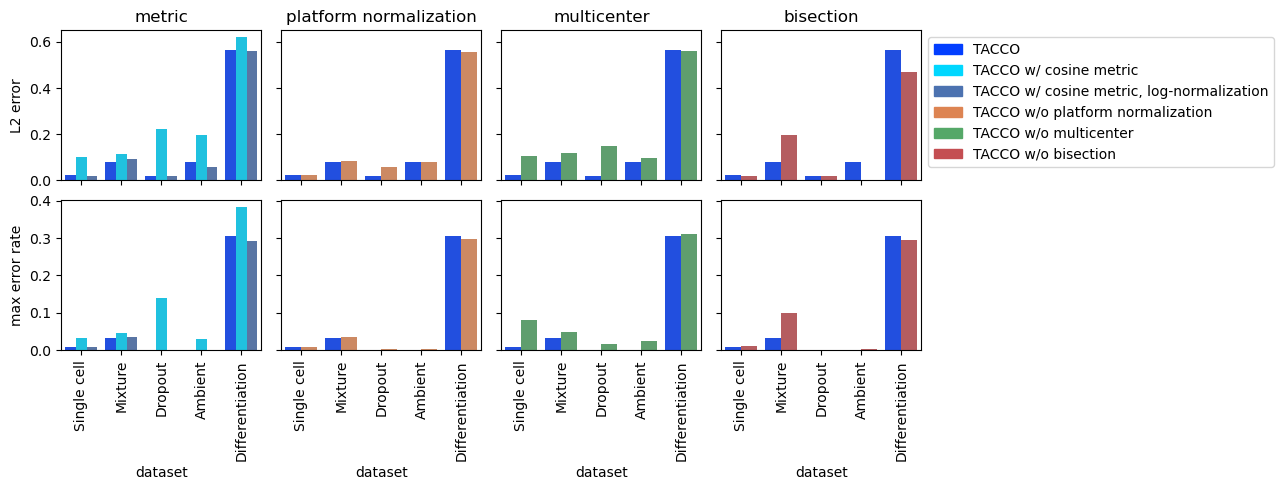
Define a set of parameters and use them to annotate all collected datasets
[9]:
methods = {
    'TACCO': {'method': 'OT', 'metric':'bc', 'multi_center': 10, 'platform_iterations': 0,'bisections':4, 'bisection_divisor':3,},
    'TACCO w/ cosine metric': {'method': 'OT', 'metric':'cosine', 'multi_center': 10, 'platform_iterations': 0,'bisections':4, 'bisection_divisor':3,},
    'TACCO w/ cosine metric, log-normalization': {'method': 'OT', 'metric':'cosine', 'log_norm': True, 'multi_center': 10, 'platform_iterations': 0,'bisections':4, 'bisection_divisor':3,},
    'TACCO w/o platform normalization': {'method': 'OT', 'metric':'bc', 'multi_center': 10, 'bisections':4, 'bisection_divisor':3, 'platform_iterations': -1,},
    'TACCO w/o multicenter': {'method': 'OT', 'metric':'bc', 'platform_iterations': 0,'bisections':4, 'bisection_divisor':3,},
    'TACCO w/o bisection': {'method': 'OT', 'metric':'bc', 'multi_center': 10,'bisections':0,'platform_iterations': 0,},
}

for dname,dataset in datasets.items():
    for method,params in methods.items():
        print(f'running method {method!r} on data {dname!r}')
        try:
            tc.tl.annotate(dataset['data'], dataset['ref'], annotation_key=dataset['ref_key'], result_key=method, **params, assume_valid_counts=True,verbose=0)
        except:
            pass # catch failing methods
running method 'TACCO' on data 'Differentiation'
running method 'TACCO w/ cosine metric' on data 'Differentiation'
running method 'TACCO w/ cosine metric, log-normalization' on data 'Differentiation'
running method 'TACCO w/o platform normalization' on data 'Differentiation'
running method 'TACCO w/o multicenter' on data 'Differentiation'
running method 'TACCO w/o bisection' on data 'Differentiation'
running method 'TACCO' on data 'Single cell'
running method 'TACCO w/ cosine metric' on data 'Single cell'
running method 'TACCO w/ cosine metric, log-normalization' on data 'Single cell'
running method 'TACCO w/o platform normalization' on data 'Single cell'
running method 'TACCO w/o multicenter' on data 'Single cell'
running method 'TACCO w/o bisection' on data 'Single cell'
running method 'TACCO' on data 'Mixture'
running method 'TACCO w/ cosine metric' on data 'Mixture'
running method 'TACCO w/ cosine metric, log-normalization' on data 'Mixture'
running method 'TACCO w/o platform normalization' on data 'Mixture'
running method 'TACCO w/o multicenter' on data 'Mixture'
running method 'TACCO w/o bisection' on data 'Mixture'
running method 'TACCO' on data 'Dropout'
running method 'TACCO w/ cosine metric' on data 'Dropout'
running method 'TACCO w/ cosine metric, log-normalization' on data 'Dropout'
running method 'TACCO w/o platform normalization' on data 'Dropout'
running method 'TACCO w/o multicenter' on data 'Dropout'
running method 'TACCO w/o bisection' on data 'Dropout'
running method 'TACCO' on data 'Ambient'
running method 'TACCO w/ cosine metric' on data 'Ambient'
running method 'TACCO w/ cosine metric, log-normalization' on data 'Ambient'
running method 'TACCO w/o platform normalization' on data 'Ambient'
running method 'TACCO w/o multicenter' on data 'Ambient'
running method 'TACCO w/o bisection' on data 'Ambient'
Collect results
[10]:
results = {}
for dname,dataset in datasets.items():
    for method,params in methods.items():
        results[(dname,method)] = {}
        results[(dname,method)]['l2'] = tc.ev.compute_err(dataset['data'], method, dataset['true_key'], err_method='lp', p=2)[method]
        results[(dname,method)]['max_correct'] = tc.ev.compute_err(dataset['data'], method, dataset['true_key'], err_method='max_correct')[method]
[11]:
res_df = pd.DataFrame([
    [dname,method,v['l2'],1-v['max_correct'],]
    for (dname,method),v in results.items()
],columns=['dataset','method','L2 error','max error rate'])
res_df['dataset'] = res_df['dataset'].astype(pd.CategoricalDtype(categories=['Single cell', 'Mixture', 'Dropout', 'Ambient', 'Differentiation', ]))
Plot results
[12]:
all_method_names = res_df['method'].unique()
quantities = ['L2 error','max error rate',]

comparisons = {
    'metric': ['TACCO', 'TACCO w/ cosine metric', 'TACCO w/ cosine metric, log-normalization'],
    'platform normalization': ['TACCO', 'TACCO w/o platform normalization'],
    'multicenter': ['TACCO', 'TACCO w/o multicenter'],
    'bisection': ['TACCO', 'TACCO w/o bisection',],
}

fig,axs = tc.pl.subplots(len(comparisons),len(quantities), axsize=axsize, x_padding=0.2, y_padding=0.2, sharey='row')
colors = {m:common_code.method_color(m) for m in all_method_names}

for jx_ax,(comp, method_names) in enumerate(comparisons.items()):
    res_sub = res_df.loc[~res_df[quantities].isna().all(axis=1)]
    res_sub = res_sub[res_sub['method'].isin(method_names)].copy()
    res_sub['method'] = res_sub['method'].astype(str)
    for iy_ax, qty in enumerate(quantities):
        ax = axs[iy_ax,jx_ax]

        sns.barplot(x="dataset", y=qty, hue="method", data=res_sub, ax=ax, palette=[colors[m] for m in method_names])

        ax.set_xticks(np.arange(len(res_sub['dataset'].cat.categories)))
        ax.set_xticklabels([])
        if iy_ax == 0:
            ax.set_title(f'{comp}')
            ax.set_xlabel(None)
        elif iy_ax == axs.shape[0] - 1:
            ax.set_xticklabels(res_sub['dataset'].cat.categories, rotation=90)
            ax.set_xlabel('dataset')
        if jx_ax == 0:
            ax.set_ylabel(f'{qty}')
        else:
            ax.set_ylabel(None)

        ax.get_legend().remove()
        if iy_ax == 0 and jx_ax == axs.shape[1] - 1:
            import matplotlib.lines as mlines
            ax.legend(handles=[matplotlib.patches.Patch(color=color, label=ind) for (ind, color) in colors.items() ],
                bbox_to_anchor=(1, 1), loc='upper left', ncol=1)
[ ]: