Mapping single cells into space
This example uses TACCO to annotate both mouse olfactory bulb Slide-Seq data (Wang et al.) with mouse olfactory bulb scRNA-seq data (Tepe et al.) and also to assign sptial positions to the scRNA-seq data using the Slide-Seq data.
(Wang et al.): Wang IH, Murray E, Andrews G, Jiang HC et al. Spatial transcriptomic reconstruction of the mouse olfactory glomerular map suggests principles of odor processing. Nat Neurosci 2022 Apr;25(4):484-492. PMID: 35314823
(Tepe et al.): Tepe B, Hill MC, Pekarek BT, Hunt PJ et al. Single-Cell RNA-Seq of Mouse Olfactory Bulb Reveals Cellular Heterogeneity and Activity-Dependent Molecular Census of Adult-Born Neurons. Cell Rep 2018 Dec 4;25(10):2689-2703.e3. PMID: 30517858
[1]:
import os
import sys

import pandas as pd
import numpy as np
import anndata as ad

import tacco as tc

# The notebook expects to be executed either in the workflow directory or in the repository root folder...
sys.path.insert(1, os.path.abspath('workflow' if os.path.exists('workflow/common_code.py') else '..'))
import common_code
Load data
[2]:
data_path = common_code.find_path('results/slideseq_mouse_olfactory_bulb')
results_path = os.path.join(common_code.find_path('results'), 'mapping_single_cells_into_space')
os.makedirs(results_path, exist_ok=True)
[3]:
reference = ad.read(f'{data_path}/reference.h5ad')
[4]:
puck = ad.read(f'{data_path}/puck_1_5.h5ad')
Annotate the spatial data with compositions of cell types
Annotation is done on cluster level to capture variation within a cell type…
[5]:
tc.tl.annotate(puck,reference,'ClusterName',result_key='ClusterName',)
Starting preprocessing
Annotation profiles were not found in `reference.varm["ClusterName"]`. Constructing reference profiles with `tacco.preprocessing.construct_reference_profiles` and default arguments...
Finished preprocessing in 13.56 seconds.
Starting annotation of data with shape (44311, 17402) and a reference of shape (51426, 17402) using the following wrapped method:
+- platform normalization: platform_iterations=0, gene_keys=ClusterName, normalize_to=adata
   +- multi center: multi_center=None multi_center_amplitudes=True
      +- bisection boost: bisections=4, bisection_divisor=3
         +- core: method=OT annotation_prior=None
mean,std( rescaling(gene) )  0.6226693400821371 8.439594522464825
bisection run on 1
bisection run on 0.6666666666666667
bisection run on 0.4444444444444444
bisection run on 0.2962962962962963
bisection run on 0.19753086419753085
bisection run on 0.09876543209876543
Finished annotation in 20.95 seconds.
[5]:
AnnData object with n_obs × n_vars = 44311 × 22170
    obs: 'x', 'y'
    obsm: 'ClusterName'
    varm: 'ClusterName'
… and then aggregated to cell type level for visualization
[6]:
cluster2type = reference.obs[['ClusterName','type']].drop_duplicates().groupby('type')['ClusterName'].agg(lambda x: list(x.to_numpy()))
type2long = reference.obs[['type','long']].drop_duplicates().groupby('long')['type'].agg(lambda x: list(x.to_numpy()))
[7]:
tc.utils.merge_annotation(puck, 'ClusterName', cluster2type, 'type');
tc.utils.merge_annotation(puck, 'type', type2long, 'long');
Annotate the spatial data with compositions of individual cells
Annotation is done on single cell level to map individual cells into space
[8]:
reference.obs['cell'] = reference.obs.index
[9]:
reference.varm['cell'] = pd.DataFrame(reference.X.T.A.astype(np.float32), index=reference.var.index, columns=reference.obs.index)
[10]:
tc.tl.annotate(puck,reference,'cell',result_key='cell',multi_center=None,)
Starting preprocessing
Finished preprocessing in 14.05 seconds.
Starting annotation of data with shape (44311, 17402) and a reference of shape (51426, 17402) using the following wrapped method:
+- platform normalization: platform_iterations=0, gene_keys=cell, normalize_to=adata
   +- multi center: multi_center=None multi_center_amplitudes=True
      +- bisection boost: bisections=4, bisection_divisor=3
         +- core: method=OT annotation_prior=None
mean,std( rescaling(gene) )  0.6226693400821371 8.439594522464825
bisection run on 1
bisection run on 0.6666666666666667
bisection run on 0.4444444444444444
bisection run on 0.2962962962962963
bisection run on 0.19753086419753085
bisection run on 0.09876543209876543
Finished annotation in 30331.17 seconds.
[10]:
AnnData object with n_obs × n_vars = 44311 × 22170
    obs: 'x', 'y'
    obsm: 'ClusterName', 'type', 'long', 'cell'
    varm: 'ClusterName', 'cell'
… and then aggregated to cell type level for visualization
[11]:
cell2cluster = reference.obs[['cell','ClusterName']].drop_duplicates().groupby('ClusterName')['cell'].agg(lambda x: list(x.to_numpy()))
[12]:
tc.utils.merge_annotation(puck, 'cell', cell2cluster, 'cell_ClusterName');
tc.utils.merge_annotation(puck, 'cell_ClusterName', cluster2type, 'cell_type');
tc.utils.merge_annotation(puck, 'cell_type', type2long, 'cell_long');
[13]:
# use consistent cell type order
puck.obsm['cell_ClusterName'] = puck.obsm['cell_ClusterName'][puck.obsm['ClusterName'].columns]
puck.obsm['cell_type'] = puck.obsm['cell_type'][puck.obsm['type'].columns]
Define position annotation of single cells in the reference via the bead with the maximum annotation in the cell-wise bead annotation
[14]:
reference.obsm['bead'] = puck.obsm['cell'].T
[15]:
tc.utils.get_maximum_annotation(reference, 'bead', result_key='max_bead')
[15]:
AnnData object with n_obs × n_vars = 51426 × 18560
    obs: 'nGene', 'nUMI', 'orig.ident', 'experiment', 'percent.mito', 'res.1.6', 'ClusterName', 'type', 'long', 'cell', 'max_bead'
    obsm: 'bead'
    varm: 'ClusterName', 'cell'
[16]:
for coord in ['x','y']:
    reference.obs[coord] = puck.obs[coord][reference.obs['max_bead']].to_numpy()
[17]:
fig, axs = tc.pl.subplots(3,13)
tc.pl.scatter({'SlideSeq beads': puck}, ['type','cell_type'], ax=axs[:1,:2], legend=False, method_labels={'type':'type based annotation', 'cell_type':'single cell based annotation'});
tc.pl.scatter({'SlideSeq beads': puck}, ['type','cell_type'], ax=axs[1:,:2], legend=False, method_labels={'type':'type based annotation', 'cell_type':'single cell based annotation'}, joint=False, cmap='viridis');
tc.pl.scatter({'single cells': reference}, 'type', ax=axs[:1,2:], legend=True, method_labels={'type':'position annotation'});
tc.pl.scatter({'single cells': reference}, 'type', ax=axs[1:,2:], legend=True, method_labels={'type':'position annotation'}, joint=False, cmap='viridis', normalize=True);
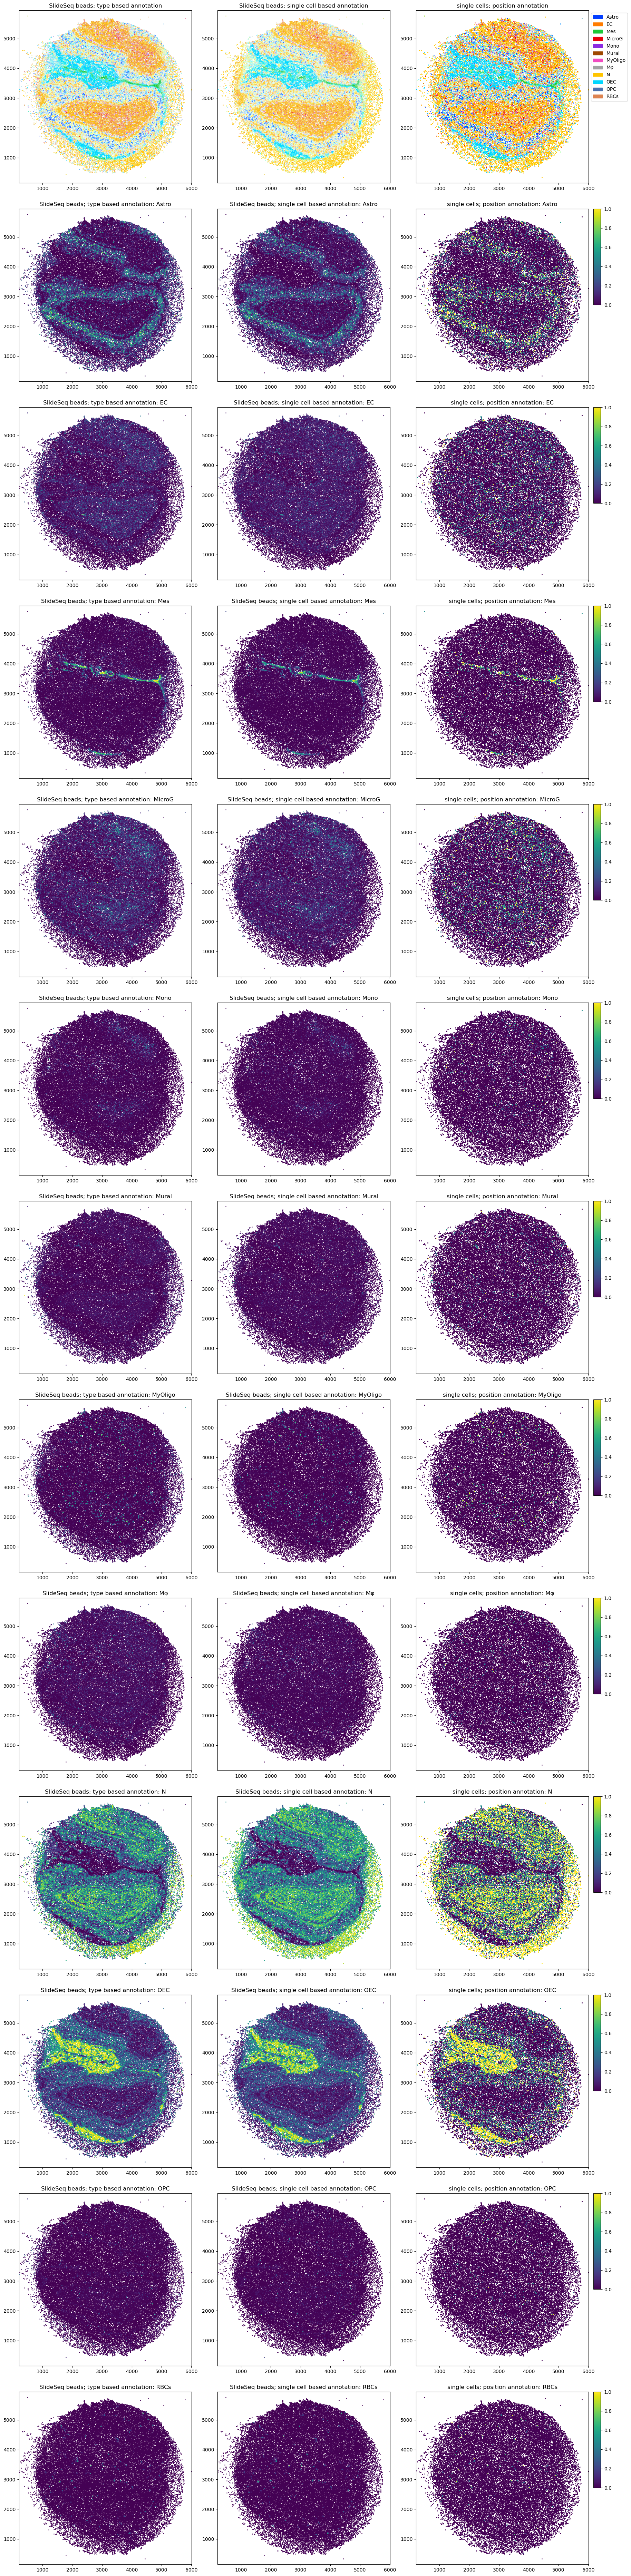
While this shows the correspondence and annotations on single cell level and on cell type (or cluster) level, using the single-cell annotation of the spatial measurements just to get some higher level annotation like cell types is strongly discouraged: the direct annotation of the beads with the annotation of interest is much more efficient as the computational effort roughly scales with the number of annotation categories. As defining the position of single cells from the maximum weighted spatial observation introduces additional noise, it is recommended to work directly on thespatial observations with the compositional annotation of interest where possible.
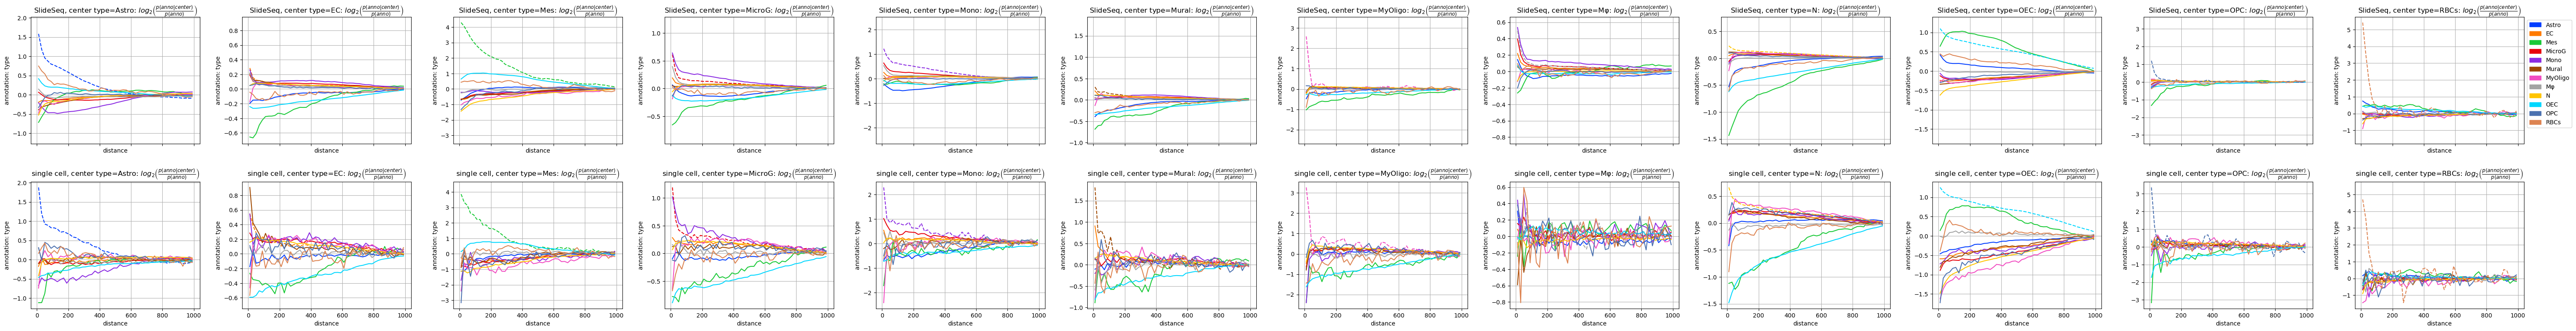
Analyse co-occurrence and neighbourhips
Downstream analyses are possible on compositionally annotated pucks as well as on the single cell data annotated with the position of the beads with maximum weight. As noted above working on the compositionally annotated spatial data is recommended if possible.
[18]:
tc.tl.co_occurrence(puck, 'type', result_key='type-type',delta_distance=20,max_distance=1000,sparse=False,n_permutation=10)
co_occurrence: The argument `distance_key` is `None`, meaning that the distance which is now calculated on the fly will not be saved. Providing a precalculated distance saves time in multiple calls to this function.
calculating distance for sample 1/1
[18]:
AnnData object with n_obs × n_vars = 44311 × 22170
    obs: 'x', 'y'
    uns: 'type-type'
    obsm: 'ClusterName', 'type', 'long', 'cell', 'cell_ClusterName', 'cell_type', 'cell_long'
    varm: 'ClusterName', 'cell'
[19]:
tc.tl.co_occurrence(reference, 'type', result_key='type-type',delta_distance=20,max_distance=1000,sparse=False,n_permutation=10)
co_occurrence: The argument `distance_key` is `None`, meaning that the distance which is now calculated on the fly will not be saved. Providing a precalculated distance saves time in multiple calls to this function.
calculating distance for sample 1/1
[19]:
AnnData object with n_obs × n_vars = 51426 × 18560
    obs: 'nGene', 'nUMI', 'orig.ident', 'experiment', 'percent.mito', 'res.1.6', 'ClusterName', 'type', 'long', 'cell', 'max_bead', 'x', 'y'
    uns: 'type-type'
    obsm: 'bead'
    varm: 'ClusterName', 'cell'
[20]:
fig = tc.pl.co_occurrence({'SlideSeq':puck,'single cell':reference}, 'type-type', log_base=2, wspace=0.25);
[ ]: